Research Article | | Peer-Reviewed

Comparison of Economic Feasibility of Different Chicken Genotypes Under On-Station Condition

Received: 2 April 2024     Accepted: 23 April 2024     Published: 10 May 2024
Views:       Downloads:
Abstract

The main objective of this study was to compare the economic feasibility of Cosmopolitan (C), Improved Horro (H), ♂Improved Horro*Cosmopolitan♀ (HC), and ♂Cosmopolitan*Improved Horro♀ (CH) in reference to Indigenous (L) and Koekoek (KK) genotypes. The study employed a completely randomized design, with a total of 180 samples (36/genotype) for egg sales, 54 samples (9/genotype) for live bird sales, and 36 samples (6/genotype) for meat sales. Each genotype's eggs, live birds, and meat sales were triplicate. All data were analyzed using the GLM model in SAS Software. At 8–24weeks, KK had the highest feed intake (AFI8–24) compared to HC, CH, and C; nevertheless, L had the lowest next to H. At 8–52 weeks, KK, CH, and HC hens had the highest feed intake (AFI8–52), whereas L, H and C hens had the lowest. L had the lowest meat yield (MYD) next to H, but the KK had the highest between 8 and 24 weeks followed by the HC, CH, and C. Live genotypes and meats sales showed that KK had the highest costs (TC1) and meat sales (TC2) followed by HC, CH and C, but the lowest for H and L. KK had the lowest total live sale return (TR1), whereas H had the highest followed by L, CH, HC, and C.L had the lowest total meat sale return (TR2), while KK had the highest followed by HC, CH, C, and H.L hen had the lowest total egg sale return (TR3) followed by C, while the highest was achieved by CH hen followed by H, KK and HC.H had the highest live net return (NR1) followed by L, CH, C, and HC, while KK had the lowest. Meat net return (NR2) was the lowest for L and the highest for KK followed by HC, CH, C, and H. H had the highest net return of egg sales (NR3) followed by CH, C, KK, and HC, but L had negatively least. H registered the highest cost-benefit ratio (TR1/TC1vs.TR3/TC3) compared to other genotypes (live chicken and eggs). KK showed the highest cost-benefit ratio (TR2/TC2) followed by HC, CH, C and H, whereas L had the lowest for meat. In conclusion, the net return and cost-benefit ratio for live genotypes, meats and eggs were notably positive and feasible except L had (for egg case) negative net return and cost-benefit ratio.

Published in International Journal of Science and Qualitative Analysis (Volume 10, Issue 1)
DOI 10.11648/j.ijsqa.20241001.11
Page(s) 1-9
Creative Commons

This is an Open Access article, distributed under the terms of the Creative Commons Attribution 4.0 International License (http://creativecommons.org/licenses/by/4.0/), which permits unrestricted use, distribution and reproduction in any medium or format, provided the original work is properly cited.

Copyright

Copyright © The Author(s), 2024. Published by Science Publishing Group

Keywords

Genotype, Chicken, Cost-Benefit Ratio, Return, Feasibility

1. Introduction
The Ethiopian chickens are reared under different management and production systems ranging from family poultry production to medium and large-scale intensive system . The chicken population in Ethiopia is estimated to be 56.99 million of which 44.94 million are indigenous, 5.19 million exotic and 6.86 million hybrid and contributing 78.85%, 9.11% and 12.03% of the country’s poultry population, respectively .
Reports have shown that the production and profitability values from sale of live chicken, meat and egg might affect the system and technology of production and productivity . Economic assessment of birds for egg or meat production is essential . The cost of producing, live bird, meat and egg affected by genotype, management, diet and appearance . Total cost, gross return, net return and cost benefit ratio were used for evaluation of chicken breeds reared for meat and egg . Scholars approved that when the price per kg of meat, per dozen of eggs and per live bird goes down; feed costs tend to decrease . Studies designed to estimate over all return on investment revealed that incidence of diseases, bio-security measures, efficient management of resources , feed and adoption of more innovation and growth rate and low productivity affect the cost-benefit ratio of poultry profitability .
The genetically improved Horro genotype of Ethiopia (H) was reported to increase growth and egg production . Moreover, Cosmopolitan genotype (C) was stated as imported chicken and was considered the symbol of global chicken diversity . Moreover, Koekoek (KK) dual-purpose chicken genotype was imported from South Africa and these were used as imported references in this study . The indigenous chicken (L) was used as a reference following the selection and breeding description studies reported in . As the cosmopolitan breed is newly imported to Ethiopia, it is evident that this genotype also demanded initial research information and documentation on economic feasibility of live birds, meat yield and egg production performances. In addition, Cosmopolitan (C), and Improved Horro (H) were directly and reciprocally crossed, Cosmopolitan ♂ * Improved Horro ♀ (CH), Improved Horro ♂ * Cosmopolitan ♀ (HC), with reasonably hypothesized variations of economic feasibility of live birds, meat and egg production performances of the genotypes, and these genotypes were compared in references to indigenous (L) and Koekoek (KK) genotypes.
General objective
The general objective of this initiated research was to compare the economic feasibility performances live birds, meat yield and egg production of different chicken genotypes.
Specific objectives
1. To compare the economic feasibility of sale of live birds of different genotypes
2. To compare the economic feasibility of sale of meats of different genotypes
3. To compare the economic feasibility of egg production of different hen genotypes
2. Materials and Methods

2.1. Description of the Study Areas

The experiment was conducted at Werer Agricultural Research Centre (WARC), Ethiopia. The Werer Agricultural Research Center is found at 280km away from Ethiopia‘s capital, Addis Ababa, and is also located at an altitude of 820 meters above sea level and at 9o 55' N latitude and 40o 40‘E longitude. The annual rainfall and average minimum and maximum temperatures for Werer Agricultural Research Center ranges from 400 mm to 600 mm, and 19.3°C and 45°C, respectively.

2.2. Experimental Animals, Managements and Sampling Procedures

2.2.1. Experimental Chicken Genotypes

The experimental animals were namely, I = Improved Horro (H), II = Cosmopolitan (C), III = Koekoek (KK), IV = Indigenous (L), V = Cosmopolitan ♂ * Improved Horro♀ (CH), and VI = Improved Horro ♂ * Cosmopolitan♀ (HC).

2.2.2. Managements and Sampling Procedures

The watering and feeding troughs were cleaned, disinfected, and sprayed against external parasites before the start of the experiment. The floor of each pen was bedded with disinfected grass hay and was replaced when deemed appropriate. All chickens (indigenous and imported) used for this trial were hatched on the same day. Chickens were fed the same commercial rations following the recommendations (Alema koudjis; Feed Co., Ltd., Debrezeit, Ethiopia). Chickens were vaccinated against Newcastle, Gumburo (Infectious Bursal Disease-IBD) and Fowl Typhoid diseases using appropriate vaccine according to the manufacturer‘s recommendation. Experimental Chickens were subjected to similar management under on-station conditions.
Health Stata were monitored during the entire trial. Feed manufactured by Alema koudjis; Feed Co., Ltd., Debrezeit, Ethiopia was used during the entire trial period and supplements were given through drinking water. Chickens were also equipped with all pre-slaughter requirements.

2.3. Animal Welfare and Ethical Procedures

The chickens were managed and kept following the guidelines approved by the institutional animal care and use committee (IACUC) and conducted jointly with the article reported by .

2.4. Economic Feasibility of the Sale of Live Chicken Genotypes

The partial economic feasibility analysis was conducted by taking into account the following parameters such as mean feed intake (AFI: kg/genotype), Mean feed cost (AFC: birr/kg), Total feed cost (TFC: birr/genotype), Vaccination (VAC), Medication (MED), Bedding straw (BED), Labor cost (Labor), Maintenance (MAIN), Total cost of sale of live chicken genotype (TC1:birr/genotype), Total return of live genotype (TR1:birr/genotype), and Net return of live chicken genotype (NR1:birr/genotype). A total of 54 (9/genotype; six genotypes) samples were used for economic feasibility of the sale of the six chicken genotypes (Live chicken genotype sale feasibility). The sale of live birds of each genotype was replicated three times. Furthermore, the partial economic feasibility for the rearing of dual-purpose chickens was evaluated following the procedure used by .

2.5. Economic Feasibility of the Sale of Meat of Chicken Genotypes

The partial economic feasibility analysis was conducted by considering the following parameters such as mean feed intake (AFI: kg/genotype), Mean feed cost (AFC: birr/kg), Total feed cost (TFC: birr/genotype), Vaccination (VAC), Medication (MED), Bedding straw (BED), Labor cost (Labor), Maintenance (MAIN), meat yield (MYD: kg/genotype), price of meat (Pm: kg/birr), Total cost of sale of meat of chicken genotype (TC2:birr/genotype), Total return of sale of meat of chicken genotype (TR2:birr/genotype), and Net return of meat of chicken genotype (NR2:birr/genotype). A total of 36 (6/genotype; six genotypes) samples were used for economic feasibility of the sale of the six chicken genotypes (Slaughter meat production feasibility). The sale of meat of each genotype was replicated three times. Furthermore, the partial economic feasibility for the rearing of dual-purpose chickens was evaluated following .

2.6. Economic Feasibility of the Sale of Egg Production of Chicken Genotypes

The partial economic feasibility analysis was conducted by focusing on the following parameters such as mean feed intake (AFI: kg/genotype), Mean feed cost (AFC: birr/kg), Total feed cost (TFC: birr/genotype), Vaccination (VAC), Medication (MED), Bedding straw (BED), Labor cost (Labor), Maintenance (MAIN), Total cost of sale of egg of chicken genotype (TC3:birr/genotype), Total return of sale of eggs of chicken genotype (TR2:birr/genotype), Vitamin premixes (VITA), price of dozen eggs (PE: birr/dozen eggs), return (revenue) of eggs per hen per year (RE: birr/egg), price of spent hen (PS: birr/genotype), Total return of sale of eggs of chicken genotype (TR3:birr/genotype), and Net return of eggs of chicken genotype (NR3:birr/genotype). A total of 180 (36/genotype; six genotypes) samples were used for economic feasibility of the sale of the six chicken genotypes (Egg production feasibility). The sale of eggs of each genotype was replicated three times. Furthermore, the partial economic feasibility for the rearing of dual-purpose chickens was evaluated following . The mortality was excluded as the chicken genotypes showed no meaningful differences at the experimental period (Starting from 8 to 24 weeks of age for live birds and meat yield; and 8 to 52 weeks for laying hens, respectively).
All in all, the partial economic feasibility was computed by using the following formulae:
NetreturnNR=TotalreturnTR-(TotalcostTC
Cost-benefitratioCBR=TotalreturnTRTotalcostTC

2.7. Statistical Analysis

The data was recorded as per the prepared sheet and was entered into excel regularly. The data collected was summarized and analyzed by GLM model using SAS software (SAS, 2004). When the GLM showed significant difference at P<0.05, the Duncan‘s multiple range tests was used for mean separation.
The model used for the analysis was:
Yij=µ+Gi+eij
Where,
Yij = the response variables
µ = the overall Mean
Gi = the effect of genotype (i=1, 2, 3, 4, 5, 6)
3. Result and Discussion
The economic feasibility of selling live (Live-EAD) chicken genotypes is presented in Table 1. The results indicate that the mean feed intake of live genotype (AFI) was significantly highest for KK, higher for HC, CH and C, intermediate for H, however, lowest for L genotypes. In line with the present result, shown that genotypes had an impact on AFI. Furthermore, fast-growing chickens had significantly greater AFI than slow-growing chickens . Total feed cost of live genotype (TFC) was found to be significantly highest for KK, intermediate for HC, CH, and C, but lowest for H and L genotypes. Because of its highest AFI, the KK genotype may have the highest total feed cost of live genotype (TFC) when compared to the other genotypes. According to the study, variations in AFC maybe the cause of the disparities in TFC. For the KK, HC, CH, and C genotypes, the total cost of the live genotype (TC1) was significantly greater, whereas the H and L genotypes showed the least cost. In line with the study, variations in TC1 of genotypes maybe influenced by variances in AFI and TFC . The live genotype (TR1) total return was significantly highest for H, higher for L, intermediate for CH, HC, and C, but lowest for KK genotypes. According to , different genotypes had different effects on the overall return (TR). Study of found that the Kuroiler breed had the highest total return (TR) followed by Sasso-R and Horro. The live genotype (NR1) net return was shown to be considerably highest for H, higher for L, intermediate for CH, C and HC, whereas lowest for KK genotypes. Kuroiler breeds had the highest net return (NR), followed by Sasso-R and Horro, according to . Net return (NR) differences may result from variations in buyers attitudes toward the breeds, feather color preferences, bodyweight, and/or genotypes .
Table 1. Evaluation of economic feasibility of sale of live (Live-EAD) chicken genotypes (8-24weeks).

Category

Genotype (G)

P-value

KK

CH

C

HC

H

L

Parameters

Mean

G

Live-EAD (8-24weeks)

AFI

11.25a

10.49b

10.31b

10.68b

9.97c

9.42d

***

AFC

13.51

13.51

13.51

13.51

13.51

13.51

Ns

TFC

151.99a

141.72b

139.29b

144.28b

134.69c

134.28c

**

VAC

3.76

3.76

3.76

3.76

3.76

3.76

Ns

MED

1.45

1.45

1.45

1.45

1.45

1.45

Ns

BED

0.85

0.85

0.85

0.85

0.85

0.85

Ns

Labor

9.73

9.73

9.73

9.73

9.73

9.73

Ns

MAIN

3.17

3.17

3.17

3.17

3.17

3.17

Ns

TC1

193.7a

184.68c

182.07c

187.43ba

177.13d

176.17d

***

TR1

296.41d

337.62c

330.95c

334.08c

365.76a

351.14b

***

NR1

102.71d

152.94c

148.88c

146.65c

188.63a

174.97b

***

AFI = feed intake (kg/genotype), TFC = Total feed cost (birr/genotype), TC1 = Total cost of live genotype (birr/genotype), TR1 = Total return of live genotype (birr/genotype), NR1 = net return of live genotype (birr/genotype), Live-EAD = live genotype economic feasibility
Table 2 shows the economic viability of selling meat (Meat-EAD) of chicken genotypes. For meat, the mean feed intake of live genotype (AFI) was found to be significantly highest for the KK, higher for the HC, CH, and C, intermediate for the H, and lowest for the L. Finding of shown that AFI differed between genotypes. Inline, the difference in body size among the chicken genotypes could affect the variation in AFI . Total feed cost of live genotype (TFC) for meat was shown to be significantly highest for the KK, intermediate for the HC, CH, and C, and lowest for the H and L. The variation in TFC may be attributed to the difference in AFI among chicken genotypes . While the lowest meat yield (MYD) was reported for the L, the highest meat yield was for the KK, higher for HC, high for CH, low for C, and H. Result of indicated that genotypes of chickens with larger bodyweights may be associated with higher meat yield compared to genotypes with smaller bodyweights. The genotypes with the highest total cost of live (TC2) for meats were KK followed by HC, CH, and C, and the genotypes with the lowest TC2 were H and L. Differences in AFI and TFC between genotypes of chickens may have an impact on genotype variations in TC2 . Meats of genotypes with the highest total return (TR2) were KK followed by HC, CH, C and H, whereas L had the lowest TR2. Differences in body weight and meat yield among chicken genotypes may attribute to variations in TR2 . KK had the largest net return of meat (NR2) followed by HC, CH, C, and H, while the L had the lowest NR2. The variations in body weight and/or genotypes may contribute to the variation in Net return (NR2) of meat of genotypes .
Table 2. Evaluation of economic feasibility of chicken breeds per bird reared for meat (Meat-EAD) production values 8-24weeks.

Category

Genotype (G)

P-value

KK

CH

C

HC

H

L

Parameters

Mean

G

Meat-EAD (8-24)

AFI

11.25a

10.49b

10.31b

10.68b

9.97c

9.42d

***

AFC

13.51

13.51

13.51

13.51

13.51

13.51

Ns

TFC

151.99a

141.72b

139.29c

144.28b

134.69d

134.28d

***

VAC

3.76

3.76

3.76

3.76

3.76

3.76

Ns

MED

1.45

1.45

1.45

1.45

1.45

1.45

Ns

BED

0.85

0.85

0.85

0.85

0.85

0.85

Ns

Labor

9.73

9.73

9.73

9.73

9.73

9.73

Ns

MAIN

3.17

3.17

3.17

3.17

3.17

3.17

Ns

MYD

1.66a

1.32c

1.13d

1.41b

1.07d

0.89e

***

Pm

350.49

350.49

350.49

350.49

350.49

350.49

Ns

TC2

193.7a

184.68bc

182.07c

187.43b

177.13d

176.17d

***

TR2

581.81a

462.65c

390.40d

494.19b

375.02d

311.94e

***

NR2

388.11a

277.97c

208.33d

306.76b

197.89d

135.77e

**

AFI = feed intake (kg/genotype), TFC = Total feed cost (birr/genotype), TC2 = Total cost of meat (birr/genotype), MYD = meat yield (kg/genotype), Pm = price of meat (kg/birr), TR2 = Total return of meat (birr/genotype), NR2 = net return of meat (birr/genotype), Meat-EAD = Meat economic feasibility
Table 3 displays the economic feasibility of egg production (Egg-EAD) of hen genotypes. The average feed intake (AFI) of hens used for egg production was shown to be significantly highest for KK, higher for CH, high for HC, moderate for C, and low for H, while L hens had the lowest AFI. According to , variations in hens' body weights and egg production capacity may have an effect on the variances in AFI. The variations in average feed intake among different hen genotypes might apparently be attributed due to genetic improvement interventions . The results indicate that the hen genotype with the greatest total feed cost (TFC) for egg production was KK followed by CH, CH, C, and H, while the lowest TFC for egg production was observed in L. Variations in AFI and genetic interventions may be responsible for the variation in TFC of hens . The hen genotypes with the highest total cost (TC3) for egg production were KK, followed by CH, CH, C, and H, while the hen genotype with the lowest TC3 was L. The differences in AFI and TFC across different hens may be the cause of the variation in TC3 of hens . A dozen eggs (PE) from a KK hen cost less than from CH, CH, C, H, and L. Variations in the cost of a dozen eggs from different genotypes of hens may result from variations of consumer preferences and genetic manipulations . The hen genotype that had the highest total return on egg production (RE) was CH, followed by H, KK, HC, H, and C. Nonetheless, the genotype with the lowest total return on egg production (RE) was L. The difference in total return of egg production might be due to variations in egg production, egg prices, buyers’ attitude to eggs and genotypes . The study revealed that L had the greatest price of spent hens (PS), followed by H, HC, CH, and C, nonetheless, KK had the lowest price of spent hens. Differences in hen genotypes and buyer preferences may be the cause of the variation in spent hen prices .
The results indicate that among the hen genotypes, CH had the highest total return of egg production (TR3), followed by H, HC, KK, and C. On the other hand, L hen had the lowest TR3. The differences in the total return of egg production could be due to the variation in egg production potential and price of spent hens of the genotypes . The results revealed that among the hen genotypes, the net return of egg production (NR3) was highest for H hens, followed by CH, C, HC, and KK. On the other hand, the L hens had the lowest and negative net return of egg production. The negative net return of egg production could be due to the least egg production potential of the hen genotype and infeasible .
Table 3. Evaluation of economic feasibility (Egg-EAD) egg production values (8-52weeks).

Category

Genotype (G)

P-value

KK

CH

C

HC

H

L

Parameters

Mean

G

Egg-EAD

AFI

44.56a

43.14ab

41.72c

42.53b

40.31d

33.09e

***

AFC

13.51

13.51

13.51

13.51

13.51

13.51

Ns

TFC

602.01a

582.82b

563.64c

574.58bc

544.59d

447.05e

***

VAC

7.52

7.52

7.52

7.52

7.52

7.52

Ns

MED

2.92

2.92

2.92

2.92

2.92

2.92

Ns

BED

1.86

1.86

1.86

1.86

1.86

1.86

Ns

Labor

18.81

18.81

18.81

18.81

18.81

18.81

Ns

MAIN

7.29

7.29

7.29

7.29

7.29

7.29

Ns

VITA

6.36

6.36

6.36

6.36

6.36

6.36

Ns

TC3

646.77a

627.58b

608.41c

619.34bc

584.35d

486.81e

***

PE

56.64a

64.08b

64.08b

64.08b

64.08b

64.08b

***

RE

866.83c

901.33a

849.65cd

856.06c

879.18b

251.31e

***

PS

143.82e

154.38c

152.63d

155.09c

158.25b

164.17a

***

TR3

1010.65c

1055.71a

1002.28d

1011.15c

1037.43b

415.47e

***

NR3

363.88d

428.13b

393.88c

391.81cd

453.08a

-71.34e

***

AFI = feed intake (kg/genotype), TFC = Total feed cost (birr/genotype), TC3 = Total cost of egg (birr/genotype), PE = price of eggs (birr/dozen eggs), RE = revenue of eggs per hen per year (birr/egg), PS = price of spent hen (birr/genotype), TR3 = Total return of egg (birr/genotype), NR3 = net return of egg (birr/genotype), Egg-EAD = Egg economic feasibility
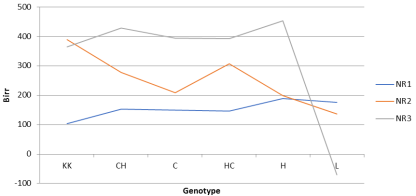
Figure 1. Net return (NR) of different chickens (birr) NR1 = Net return of live genotype, NR2 = Net return of meat, NR3 = Net return of egg.
The net return of sales of live chicken genotypes (NR1), slaughtered meat (NR2) and egg production of laying hens (NR3) is presented in Figure 1. H had the highest live sale net return (NR1) followed by L, CH, C, and CH but KK was the least feasible for live sale. The possible explanation for least income of KK compared to the rest genotypes is due to its feather color (although heavier). KK genotype had the highest meat net return (NR2) followed by HC, CH, C and HC, while L genotype had the lowest meat net return. In line with the finding, the higher meat net return might be due to heavy body weight resulting in high meat yield . H had the highest and positive egg net return (NR3) compared to CH, C, HC and KK, whereas L genotype was negative and the least viable. The negative egg net return of genotype is ascribed to least egg production potential and infeasible .
The cost-benefit of sales of live chicken genotypes (TR1/TC1), slaughtered meat (TR2/TC2) and egg production of laying hens (TR3/TC3) is presented in Figure 2. H had the highest live sale cost-benefit ratio (TR1/TC1) followed by L, CH, C, and CH but KK was the least feasible for live sale. According to , rearing cost and cost-benefit ratio varied across chicken genotypes (Leghorn vs. Fayoumi). The possible explanation for least income of KK compared to the rest genotypes is due to its feather color (although heavier). In accordance with the study, found that different chicken genotypes are not always feasible based on their genotype growth rate. KK genotype had the highest meat cost-benefit ratio (TR2/TC2) followed by HC, CH, C, HC and H, nevertheless, L genotype had the lowest meat cost-benefit ratio. According to , differences in the cost-benefit ratio of the meats of various chickens can be explained by feed consumption and growth performances. H had the highest and positive egg cost-benefit ratio (TR3/TC3) compared to CH, C, HC and KK, whereas L genotype was negative and the least viable. According to , variations in spent hen, egg production, feed consumption, total cost of rearing, and total income are the factors contributing to the variations in cost-benefit ratios.
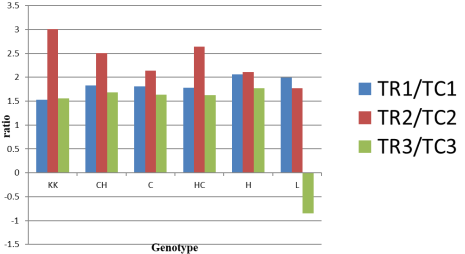
Figure 2. Cost benefit Ratio (CBR) of different chickens: TR1/TC1 = cost-benefit ratio of live genotype, TR2/TC2 = Cost-benefit ratio of meat, TR3/TC3 = Cost-benefit ratio of egg.
4. Conclusion and Recommendation
At 8–24 weeks of age,- KK had the highest feed intake (AFI8–24) compared to HC, CH, and C; nevertheless, L had the lowest next to H. At 8–52 weeks of age, the KK, CH, and HC hens had the highest feed intake (AFI8–52), whereas L, H and C hens had the lowest AFI8–52. KK had the highest total feed cost (TFC) followed by the HC, CH, and C, however, H and L had the lowest TFC between 8 and 24 weeks of age. Between 8 and 52 weeks of age, L hen had the lowest total feed cost (TFC), whereas KK hen had the highest TFC followed by CH, HC, C, and H. L had the lowest meat yield (MYD) next to H, but the KK had the highest MYD between 8 and 24 weeks of age followed by the HC, CH, and C. Live chicken genotypes and meats sales viability showed that the KK had the highest costs of live chicken (TC1) and meat sales (TC2) followed by HC, CH and C, but the lowest for H and L. KK had the lowest total live sale return (TR1), whereas H had the highest TR1 followed by L, CH, HC, and C.L had the lowest total meat sale return (TR2), while KK had the highest followed by HC, CH, C, and H. L hen had the lowest total egg sale return (TR3) followed by C, while the highest TR3 was achieved by the CH hen followed by H, KK and HC.H had the highest live net return (NR1) followed by L, CH, C, and HC, while KK had the lowest NR1. Meat net return (NR2) was the lowest for L and the highest for KK followed by HC, CH, C, and H. H had the highest net return on egg sales (NR3) followed by CH, C, KK, and HC, but L had negatively least. H registered the highest cost-benefit ratio (TR1/TC1vs.TR3/TC3) compared to other genotypes (live chicken and eggs). KK showed the highest cost-benefit ratio (TR2/TC2) followed by HC, CH, C and H, whereas L had the lowest TR2/TC2 for meat. In conclusion, the net return and cost-benefit ratio for live genotypes, meat and egg were notably positive and feasible except L had (for egg case) negative net return and cost-benefit ratio.
Abbreviations
AFI: Average Feed Intake
CBR: Cost-Benefit Ratio
Egg-EAD: Egg Economic Feasibility
Live-EAD: Live Bird Economic Feasibility
Meat-EAD: Meat Economic Feasibility
NR: Net Return
TC: Total Cost
TFC: Total Feed Cost
TR: Total Return
Acknowledgments
The authors express gratitude to the International Livestock Research Institute (ILRI-ACGG, Addis Ababa, Ethiopia; Grant code: BS13CRP001CRP001111) for funding the research and the Ethiopian Institute of Agricultural Research (EIAR) for providing necessary opportunities.
Author Contributions
Misba Alewi Abdu: Formal Analysis, Supervision, Methodology, Writing - review & editing
Atsbaha Hailemariam Gebreslassie: Software, Formal Analysis, Methodology, Writing - review & editing
Data Availability Statement
Data will be made available on request.
Conflicts of Interest
The authors declare no conflicts of interests.
References
[1] Afolami, C. A., Aladejebi, O. J., & Okojie, L. O. (2013). Analysis of profitability and constraints in poultry egg farming under battery cage and deep litter systems in Ogun State, Nigeria: a comparative study. IJAFS, 4(2013), 20.
[2] Alabi, A., & Aruna, B. (2005). Technical efficiency of family poultry production in Niger-Delta, Nigeria. Journal of Central European Agriculture.
[3] Amalia, F. R., Daryanto, A., & Rujito, H. (2015). Comparative feasibility analysis of modern and traditional system of broiler chicken farm business. Indonesian Journal of Business and Entrepreneurship (IJBE), 1(2), 90-90.
[4] Arega, H., Alemu, F., Getnet, M., & Abiyu, Y. (2021). Performance of Cobb500 Broilers under On-station Management at Pawe. Livestock Research Results, 841.
[5] Desalew, T., 2012. Management practices, productive performances and egg quality traits of exotic chickens under village production system in east Shewa, Ethiopia. M.Sc Thesis, Addis Ababa University, Debre Zeit, Ethiopia.
[6] Assefa, S., Melesse, A. and Banerjee, S. (2019) Egg Production and Egg Quality Traits of Local and Exotic Chicken Breeds Reared in Two Agroecologies under Traditional Management System. Research Journal of Food and Nutrition, 3, 11-17.
[7] Ayinde, I. A., Ibrahim, S. B., & Arowolo, S. O. (2012). Economics of poultry egg production under two management systems in Ogun State, Nigeria. Nigerian Journal of Agricultural Economics, 3(1), 40-49.
[8] Bedru, B. A. (2021). Comparative performance evaluation of local and tropical adapted exotic breeds of chickens in Ethiopia. Doctoral Dissertation, Haramaya University, Ethiopia.
[9] Begum, I. A., Buysse, J., Alam, M. J., & Van Huylenbroeck, G. (2010). Technical, allocative and economic efficiency of commercial poultry farms in Bangladesh. World's Poultry Science Journal, 66(3), 465-476.
[10] Belewu, K. Y., Ibrahim, H. K., Ajibade, B. T., & Adewusi, O. G. (2019). The cost benefit analysis of incorporating fungus treated Castor seed cake (FTCSC) (Ricinuscommunis) in the diet of (WAD) GOAT.
[11] CSA (Central Statistical Agency). 2020/21. Report on Livestock and Livestock Characteristics (Private Peasant Holdings), Agricultural Sample Survey, Volume II Statistical Bulletin 587. Addis Ababa, Ethiopia.
[12] Das, P. K., Ghosh, P. R., Pradhan, S., Roy, B., & Mazumdar, D. (2014). Benefit cost analysis of Rhode Island Red chicken rearing in backyard on the basis of egg production performance.
[13] Dawud, I. Y. 2019. Comparative study of production and reproductive performance of parent stock and commercial layer chickens under different management conditions in Ethiopia. Doctoral Dissertations, Addis Ababa University, Addis Ababa, Ethiopia. Science Journal, 10(1), 35-44.
[14] Dutta, R. K., Islam, M. S., & Kabir, A. (2012). Assessment of the production performance and economic efficiencies of available chicken breeds (Gallus domesticus L.) in Rajshahi, Bangladesh. Univ. J. Zool. Rajshahi Univ, 31, 13-18.
[15] FAO (Food and Agriculture Organization). 2019. Poultry Sector Ethiopia. FAO Animal Production and Health Livestock Country Reviews. No. 11. Rome. Italy.
[16] Gafar, E. G., Abdo, S. G., Mahrous, M. Y., & Kamal, M. A. (2022). Effect of strain and sex on productive performance and carcass traits in some broiler chickens. Archives of Agriculture Sciences Journal, 5(1), 77-87.
[17] Getnet, Z., Mengistu, U., Getachew, A., Wondmeneh, E., Tadelle, D. (2022) Comparative growth performance and carcass characteristics of guinea fowl (Numida meleagris) and three chicken genotypes. Ethiop. J. Sci. & Technol. 15(1): 81-99.
[18] Hailemariam, A., Esatu, W., Abegaz, S., Urge, M., Assefa, G., & Dessie, T. (2022). Effect of genotype and sex on breast meat quality characteristics of different chickens. Journal of Agriculture and Food Research, 10, 100423.
[19] Halima, H., Neser, F. W. C., van Marle-Koster, E., & De Kock, A. (2007). Phenotypic variation of native chicken populations in northwest Ethiopia. Tropical animal health and production, 39, 507-513.
[20] Hassen, H., Neser, F. W. C., De Kock, A., & van Marle-Köster, E. (2009). Study on the genetic diversity of native chickens in northwest Ethiopia using microsatellite markers. African journal of Biotechnology, 8(7).
[21] Islam, R., Nath, P., Bharali, A., & Borah, R. (2015). Analysis of benefit-cost (B: C) ratio of Vanaraja and local chicken of Assam under backyard system of rearing. Journal of Research in Agriculture and Animal Science, 3(7), 7-10.
[22] Müller, S. K. (2018). Meat and egg production with dual-purpose poultry: biological background, feed requirements and efficiency, meat and egg quality (Doctoral dissertation, ETH Zurich).
[23] Setiasih, S., Abdurrahman, A. M., Hermanto, C., & Saeri, M. (2021). Type and Feasibility of Agribusiness of Kub Chicken Household Scale. In E3S Web of Conferences (Vol. 316, p. 01003). EDP Sciences.
[24] Sheikh, I. U., Kalita, N., & Mahanta, J. D. (2018). Economic analysis of indigenous, Vanaraja, and crossbred (PB2x Indigenous) chickens under intensive system of rearing.
[25] Stinckens, A., Vereijken, A., Ons, E., Konings, P., Van As, P., Cuppens, H., & Cassiman, J. I. (2015). Art meets science: The Cosmopolitan Chicken Research Project. Facts, views & vision in ObGyn, 7(3), 163.
[26] Wondmeneh, E. W. 2015. Genetic improvement in indigenous chicken of Ethiopia. Genetic improvement in indigenous chicken of Ethiopia.
Cite This Article
  • APA Style

    Abdu, M. A., Gebreslassie, A. H. (2024). Comparison of Economic Feasibility of Different Chicken Genotypes Under On-Station Condition. International Journal of Science and Qualitative Analysis, 10(1), 1-9. https://doi.org/10.11648/j.ijsqa.20241001.11

    Copy | Download

    ACS Style

    Abdu, M. A.; Gebreslassie, A. H. Comparison of Economic Feasibility of Different Chicken Genotypes Under On-Station Condition. Int. J. Sci. Qual. Anal. 2024, 10(1), 1-9. doi: 10.11648/j.ijsqa.20241001.11

    Copy | Download

    AMA Style

    Abdu MA, Gebreslassie AH. Comparison of Economic Feasibility of Different Chicken Genotypes Under On-Station Condition. Int J Sci Qual Anal. 2024;10(1):1-9. doi: 10.11648/j.ijsqa.20241001.11

    Copy | Download

  • @article{10.11648/j.ijsqa.20241001.11,
      author = {Misba Alewi Abdu and Atsbaha Hailemariam Gebreslassie},
      title = {Comparison of Economic Feasibility of Different Chicken Genotypes Under On-Station Condition
    },
      journal = {International Journal of Science and Qualitative Analysis},
      volume = {10},
      number = {1},
      pages = {1-9},
      doi = {10.11648/j.ijsqa.20241001.11},
      url = {https://doi.org/10.11648/j.ijsqa.20241001.11},
      eprint = {https://article.sciencepublishinggroup.com/pdf/10.11648.j.ijsqa.20241001.11},
      abstract = {The main objective of this study was to compare the economic feasibility of Cosmopolitan (C), Improved Horro (H), ♂Improved Horro*Cosmopolitan♀ (HC), and ♂Cosmopolitan*Improved Horro♀ (CH) in reference to Indigenous (L) and Koekoek (KK) genotypes. The study employed a completely randomized design, with a total of 180 samples (36/genotype) for egg sales, 54 samples (9/genotype) for live bird sales, and 36 samples (6/genotype) for meat sales. Each genotype's eggs, live birds, and meat sales were triplicate. All data were analyzed using the GLM model in SAS Software. At 8–24weeks, KK had the highest feed intake (AFI8–24) compared to HC, CH, and C; nevertheless, L had the lowest next to H. At 8–52 weeks, KK, CH, and HC hens had the highest feed intake (AFI8–52), whereas L, H and C hens had the lowest. L had the lowest meat yield (MYD) next to H, but the KK had the highest between 8 and 24 weeks followed by the HC, CH, and C. Live genotypes and meats sales showed that KK had the highest costs (TC1) and meat sales (TC2) followed by HC, CH and C, but the lowest for H and L. KK had the lowest total live sale return (TR1), whereas H had the highest followed by L, CH, HC, and C.L had the lowest total meat sale return (TR2), while KK had the highest followed by HC, CH, C, and H.L hen had the lowest total egg sale return (TR3) followed by C, while the highest was achieved by CH hen followed by H, KK and HC.H had the highest live net return (NR1) followed by L, CH, C, and HC, while KK had the lowest. Meat net return (NR2) was the lowest for L and the highest for KK followed by HC, CH, C, and H. H had the highest net return of egg sales (NR3) followed by CH, C, KK, and HC, but L had negatively least. H registered the highest cost-benefit ratio (TR1/TC1vs.TR3/TC3) compared to other genotypes (live chicken and eggs). KK showed the highest cost-benefit ratio (TR2/TC2) followed by HC, CH, C and H, whereas L had the lowest for meat. In conclusion, the net return and cost-benefit ratio for live genotypes, meats and eggs were notably positive and feasible except L had (for egg case) negative net return and cost-benefit ratio.
    },
     year = {2024}
    }
    

    Copy | Download

  • TY  - JOUR
    T1  - Comparison of Economic Feasibility of Different Chicken Genotypes Under On-Station Condition
    
    AU  - Misba Alewi Abdu
    AU  - Atsbaha Hailemariam Gebreslassie
    Y1  - 2024/05/10
    PY  - 2024
    N1  - https://doi.org/10.11648/j.ijsqa.20241001.11
    DO  - 10.11648/j.ijsqa.20241001.11
    T2  - International Journal of Science and Qualitative Analysis
    JF  - International Journal of Science and Qualitative Analysis
    JO  - International Journal of Science and Qualitative Analysis
    SP  - 1
    EP  - 9
    PB  - Science Publishing Group
    SN  - 2469-8164
    UR  - https://doi.org/10.11648/j.ijsqa.20241001.11
    AB  - The main objective of this study was to compare the economic feasibility of Cosmopolitan (C), Improved Horro (H), ♂Improved Horro*Cosmopolitan♀ (HC), and ♂Cosmopolitan*Improved Horro♀ (CH) in reference to Indigenous (L) and Koekoek (KK) genotypes. The study employed a completely randomized design, with a total of 180 samples (36/genotype) for egg sales, 54 samples (9/genotype) for live bird sales, and 36 samples (6/genotype) for meat sales. Each genotype's eggs, live birds, and meat sales were triplicate. All data were analyzed using the GLM model in SAS Software. At 8–24weeks, KK had the highest feed intake (AFI8–24) compared to HC, CH, and C; nevertheless, L had the lowest next to H. At 8–52 weeks, KK, CH, and HC hens had the highest feed intake (AFI8–52), whereas L, H and C hens had the lowest. L had the lowest meat yield (MYD) next to H, but the KK had the highest between 8 and 24 weeks followed by the HC, CH, and C. Live genotypes and meats sales showed that KK had the highest costs (TC1) and meat sales (TC2) followed by HC, CH and C, but the lowest for H and L. KK had the lowest total live sale return (TR1), whereas H had the highest followed by L, CH, HC, and C.L had the lowest total meat sale return (TR2), while KK had the highest followed by HC, CH, C, and H.L hen had the lowest total egg sale return (TR3) followed by C, while the highest was achieved by CH hen followed by H, KK and HC.H had the highest live net return (NR1) followed by L, CH, C, and HC, while KK had the lowest. Meat net return (NR2) was the lowest for L and the highest for KK followed by HC, CH, C, and H. H had the highest net return of egg sales (NR3) followed by CH, C, KK, and HC, but L had negatively least. H registered the highest cost-benefit ratio (TR1/TC1vs.TR3/TC3) compared to other genotypes (live chicken and eggs). KK showed the highest cost-benefit ratio (TR2/TC2) followed by HC, CH, C and H, whereas L had the lowest for meat. In conclusion, the net return and cost-benefit ratio for live genotypes, meats and eggs were notably positive and feasible except L had (for egg case) negative net return and cost-benefit ratio.
    
    VL  - 10
    IS  - 1
    ER  - 

    Copy | Download

Author Information